A GENTLE INTRO TO OUR HIGH-DIMENSIONAL PATTERN MINING
We shall use our COVID-19 study to illustrate how our high-dimensional pattern mining method generally works. In the COVID-19 analysis we can think of every US county as an (observational) experiment; each has certain characteristics which makes it unique, and similar to some others at the same time. Our pattern mining engine looks for regions in this feature space that are occupied with similar counties that all respond in a similar way to a given target variable of interest — the COVID-19 death rate.
The criteria that determine ‘similarity’ are grounded in sophisticated statistical pattern mining — a core technology we market. It can be applied to any domain, not just to predict the outcomes for a pandemic disease.
In the following we offer a gentle introduction to the subject.
Example: the COVID-19 dataset
For the COVID-19 data analytics we used data from the prominent Kaggle repository UNCOVER COVID-19 Challenge sponsored by the Roche Data Science Coalition. This dataset has about 500 attributes, covering demographics, economics, infrastructure, etc. for each of the 3,007 US counties. It gives us a spreadsheet (called the rectangular data matrix) with 3,007 rows (the counties) and 500 columns (the attributes). Using this dataset we study why some counties experience higher death rates, what the risk factors are, and whether there are interesting joint relationships.
A very sparse and lonely space
This data matrix can be thought of as a 500-dimensional space filled with 3,007 data points — the counties. This is a very sparse and lonely space where regions with denser clusters of points are difficult to find. In some sense, it’s like outer space where astronomers look for remote galaxies. But instead of the vast depth of the three-dimensional universe, our space is much smaller, but with many more dimensions. The effect is the same – the volume gets very large and equally sparse and there is a large number of very interesting data galaxies we can learn about.
Each US county is an observational experiment
We can think of every US county as an (observational) experiment; each has certain characteristics which makes it unique, and similar to some others at the same time. Our pattern mining engine looks for regions in data space occupied with counties that behave similarly in terms of a given response variable. In this case, the variable of interest is the number of COVID-19 deaths in relation to each county’s population, also called the death rate. The regions of similar counties are our (data) galaxies. Note that counties that are considered similar do not need to be geographically connected. The criteria that determine ‘similarity’ are grounded in sophisticated statistics. Let’s not go there to keep it simple.
Dividing the space is key
Now to the good news. It turns out that these regions can usually be succinctly described by just a small set of attributes, giving rise to what is called a subspace. This is the inherent power of our approach; the easy explanations of the various galaxies.
So many directions, so little time
But before we board our spaceship, we need to delve into one more piece of theory that matters a lot. It’s related to the vast number of dimensions of our galactic data space. When you travel in, say, 500-dimensional space you can turn your head and look into 500 directions. But these are not ordinary 500 directions. These 500 directions are often completely independent.
Showing you the way
Let’s make this more concrete. In the ordinary everyday space we live in there is up and down, forward and backward, left and right. That’s three dimensions. In 500-dimensional space we have many more directions, unimaginable to the human mind. That’s why explaining stuff that happens in high-dimensional space is so immensely difficult. And that’s why we invented our pattern mining method. It allows us to look at hard-to-think-about high-dimensional phenomena in easy-to-imagine low-dimensional subspaces (oops, here is that word again).
Traveling to remote galaxies of data
And that’s also where travel in high-dimensional space is different from traveling to distant galaxies. The galaxies we find are really always the same stars (the counties) but they look different from different high-dimensional viewpoints. And these views are fully independent; just like galaxies.
Making it visual
Is your head spinning yet? Indeed it sounds rather strange, and fascinating at the same time. You’ll get the hang of it once you look at a few examples with your own eyes. Remember, it’s also hard to imagine the Eiffel Tower without having seen at least a picture of it.
Let's go on the deep data space journey
Let’s board our spaceship and go on an excursion of the high-dimensional space of our COVID-19 dataset. Let find out why some counties experience higher death rates. Let’s investigate what the risk factors are, and whether are there interesting joint relationships.
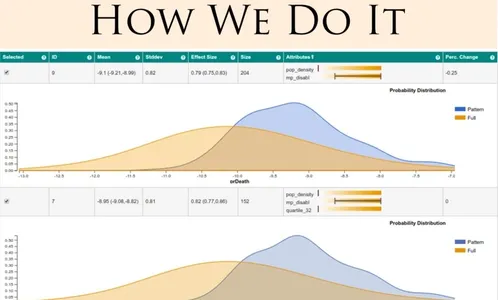
What we will see
At each stop, we will be examining a specific galaxy in the high-dimensional COVID-19 data space. Each galaxy is a subspace pattern with above-average COVID-19 death rate. We will visualize it as a sequence of views, each refining the description of the subspace until the pattern is fully explained. In some sense this sequence is like the pictures we get with a telescope where we continuously hone in until we have the galaxy (the cluster of county points) in full focus, and nothing else.